Retirement Equity Optimiser
Reliable & regular access to capital, capital protection, growth potential and reducing investment timing risks.
Enquire Today
Call us on 02 8098 0300 or complete the form below and we’ll be in touch with you as soon as possible.
C2 Retirement Equity Optimiser has been designed to address key investment objectives that many investors are seeking as they are entering retirement in a single investment, such as reliable and regular access to capital, capital protection, growth potential and reducing investment timing risks.
In other words, Retirement Equity Optimisation.
Equity Optimiser Overview
The primary goal is to empower retirees with a tool that not only aims to safeguard their wealth and provide access to regular, reliable cash flows, but also allows for strategic wealth accumulation to potentially continue at the same time.
- Key Features
- Cashflow Example
- Historical Returns
- Key Risks
- Downloads
Key Features
- Capital Protection1
- Regular Cash Flow: 10% p.a tax free Capital Returns3
- Sequencing Risk Solutions (Timing Risk)
- Growth Potential
- Leverage
The investment incorporates capital protection mechanisms, ensuring that the principal amount invested remains protected throughout the 10-year term, where the Units are held to Maturity2 . This feature can help provide investors with peace of mind, knowing that their initial Investment Amount is returned to them, shielded from market volatility.
Investors receive regular cash flows via 10% p.a3 Capital Returns (monthly, commencing from Year 2). These payments are tax free as per ATO PR 2024/17. Importantly, Investors will not miss out on any growth, as the initial Investment exposure remains the same all the way through to Maturity, despite the Capital Returns. Investors can plan ahead knowing their Investment will remain fully exposed to growth, and that their original invested capital will be returned on a steady, regular basis, allowing it to be applied to other purposes, such as to help cover living expenses, medical costs, and other financial obligations.
Selling part of a portfolio to fund cash flow needs isn’t always ideal, especially in a depressed market. Selling down a portfolio can have significant long- term impacts on compounding growth, especially in the earlier years of the investment journey or when the portfolio prices are low. C2 Retirement Equity Optimiser Units help manage this risk, as the investment exposure remains fully invested over the 10 year term despite returning all the investors capital over the term via tax free Capital Returns3 .
The investment offers investors exposure to the US stock market via the BNP Paribas US Equities Dynamic AUD Hedged Index. Not only do investors maintain their full investment exposure over the 10- year term (despite having the Issue Price fully refunded to them over 10 years 3 ), the index dynamically employs internal leverage at the index level of up to 250% (using a 15% volatility target) to potentially amplify returns (but at the risk of also potentially amplifying losses).
The Investment includes internal leverage via a 145% Participation Rate to any positive performance of the Reference Asset at Maturity, and provides an opportunity for enhanced, compound growth potential without many of the traditional risks associated with leverage 4 .
Capital Protection1
The investment incorporates capital protection mechanisms, ensuring that the principal amount invested remains protected throughout the 10-year term, where the Units are held to Maturity 2 . This feature can help provide investors with peace of mind, knowing that their initial Investment Amount isreturned to them, shielded from market volatility.
Growth Potential:
The investment incorporates capital protection mechanisms, ensuring that the principal amount invested remains protected throughout the 10-year term, where the Units are held to Maturity 2 . This feature can help provide investors with peace of mind, knowing that their initial Investment Amount isreturned to them, shielded from market volatility.
Cashflow Example
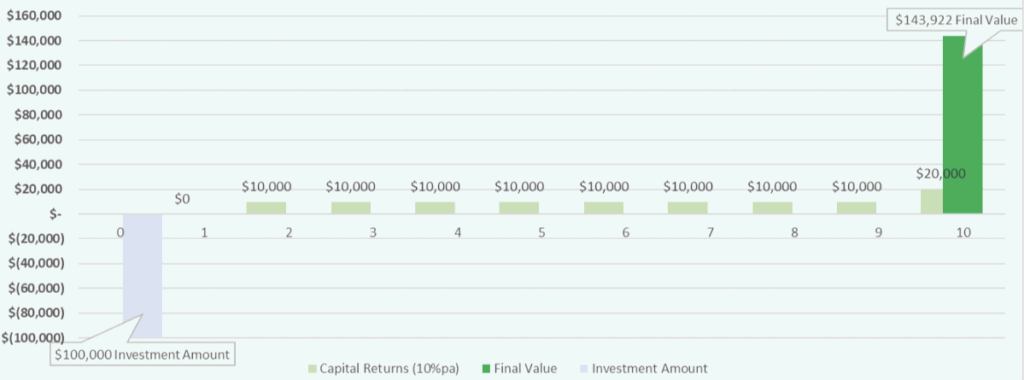
The below example is hypothetical and for illustrative purposes only. It shows how the cash flow on a $100,000 investment would work, assuming 9% p.a performance of the Reference Asset, 145% Participation Rate Averaging at the beginning and end of the Investment Term and comprising:
- An initial Investment of $100,000 during the Initial Offer Period;
- Capital Returns each year commencing from Year 2 of $10,000 (10% p.a) 5 , including a final $10,000Capital Return at the end of Year 10, totalling $100,000.
Based on the above assumptions, the investor would receive a Final Value of $143,922 at Maturity in addition to the $100,000 paid to Investors over the Investment Term via Capital Returns.
5Refer to “Capital Return” in Section 1 and 2 of the Term Sheet PDS & Section 5 “Key Risks”.
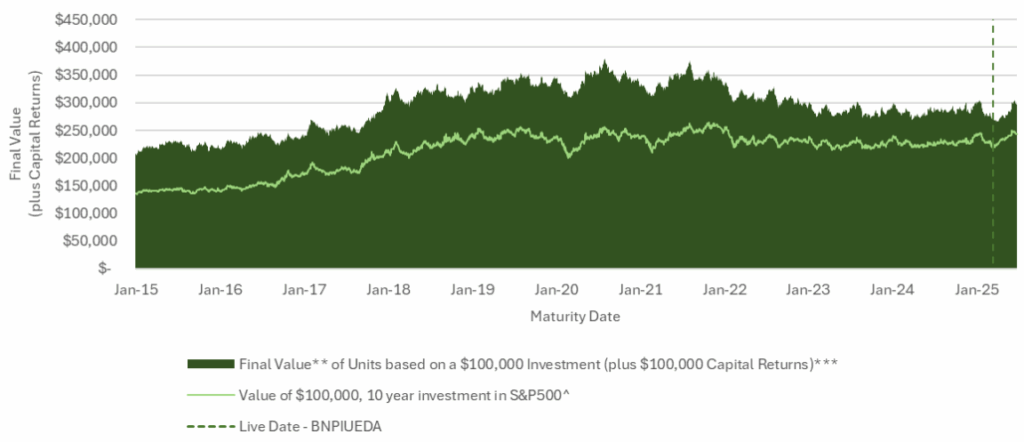
Historical 10 Year Return Back Tests
The following back tests are provided to show how an investment with the features offered under this Term Sheet PDS may have performed based on daily rolling 10 Year periods with rolling 10 Year Maturity Dates* for the period 1 February 2005 to 24 July 2025. A total of 2,637 10 Year back tests were run.
The Final Value is based on a $100,000 Investment made during the Initial Offer Period and is in addition to Capital Returns which would have totalled $100,000 during the Investment Term. The results are not actual returns as the Units were not available at the time, nor was the Reference Asset available for the full period of the back test.
The back tests have been provided for potential investors to help assist with their investment research and is not an indicator of likely future performance. Investors should perform their own independent analysis.
| Rolling 10 Year Backtest | S&P500 10 Year Performance (Adjusted for Averaging)^ | Value of $100,000 investment in S&P500^ | C2 Retirement Equity Optimiser Units (Adjusted for 145% Participation Rates and Averaging)** | Final Value** of Units based on a $100,000 investment (plus $100,000 Capital Returns)*** | IRR# |
|---|---|---|---|---|---|
| Average | 111.9% (7.8%p.a) | $211,900 | 192.0%(11.3%p.a) | $299,388 ($199,338 Final Value) |
13.69%p.a |
| Median | 126.4%(8.5%p.a) | $226,400 | 195.6%(11.4%p.a) |
$302,638 |
13.83%p.a |
| Minimum | 34.9%(3.0%p.a) | $134,900 | 104.5%(7.4%p.a) |
$213,100 |
9.48%p.a |
| Maximum | 164.8%(10.2%p.a) | $264,800 | 283.5%(14.4%p.a) | $389,420 ($289,420 Final Value) |
16.87%p.a |
| Last (24 July 2025) |
144.0%(9.3%p.a) | $244,000 | 197.5%(11.5%p.a) |
$277,915 |
13.91%p.a |
Historical Final Value (Backtest) in addition to $100,000 Capital Returns.
Rolling 10 Year Maturity.
Key Risks
Downloads
Flyer
Term Sheet PDS
Target Market Determination (TMD)
Master PDS including ATO Tax Ruling
Find out more about Equity Optimiser today.
Call C2 Specialist Investments on 02 8098 0300.
© 2025 C2 Financial Group | Visit Main Website